Inferring the Equation of State of Neutron Stars
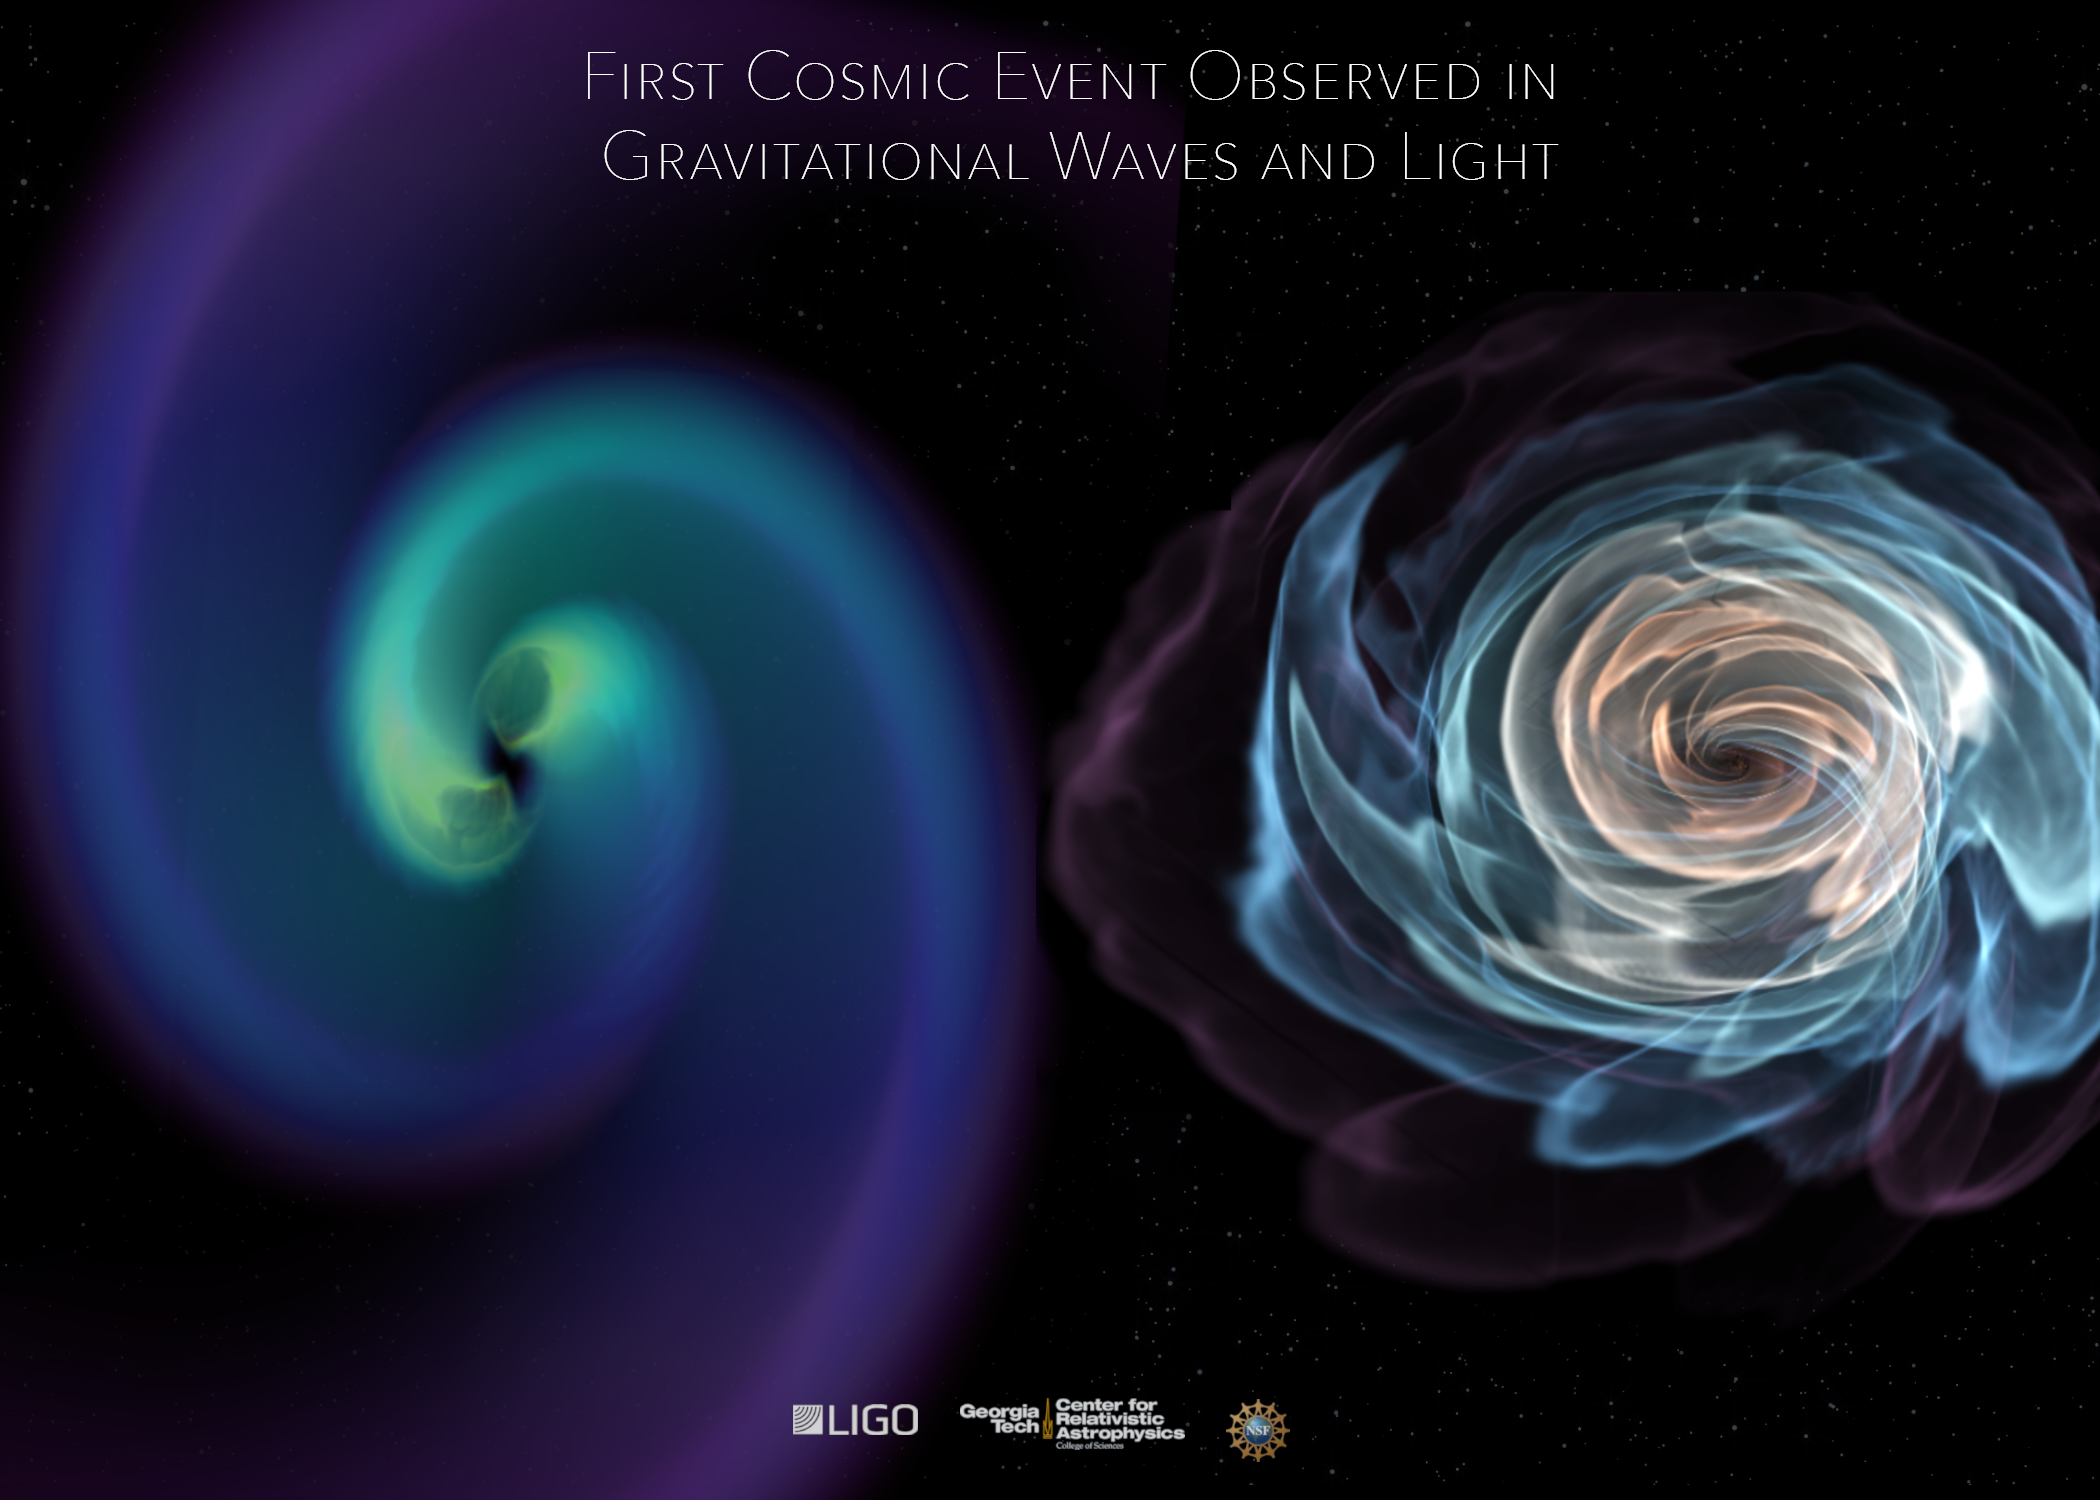
Image Credit - T. Dietrich (Potsdam University and Max Planck Institute for Gravitational Physics), N. Fischer, S. Ossokine, H. Pfeiffer (Max Planck Institute for Gravitational Physics), T. Vu. Numerical-relativity simulation - S.V. Chaurasia (Stockholm University), T. Dietrich (Potsdam University and Max Planck Institute for Gravitational Physics)
So my work in undergrad mainly entailed model comparison and inference on the equation of state of neutron stars. I did this work at Montclair State University with Shaon Ghosh as my PI. We worked together on this topic for about three years.
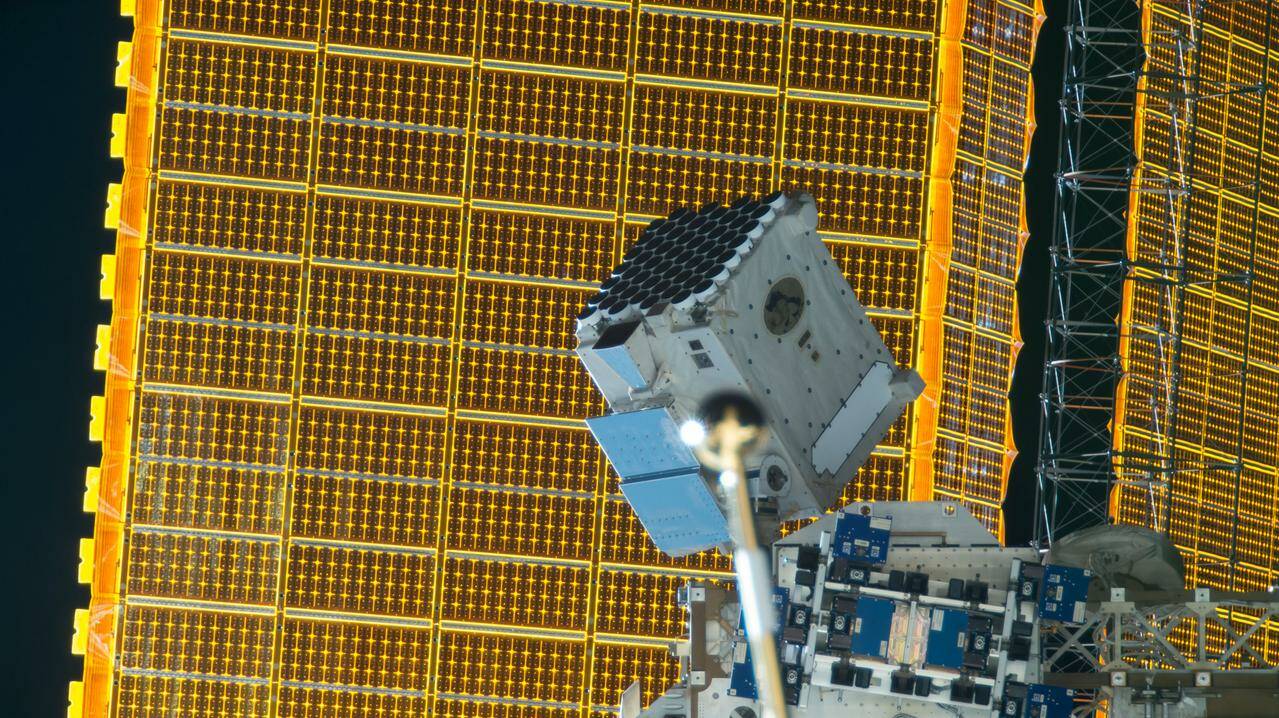
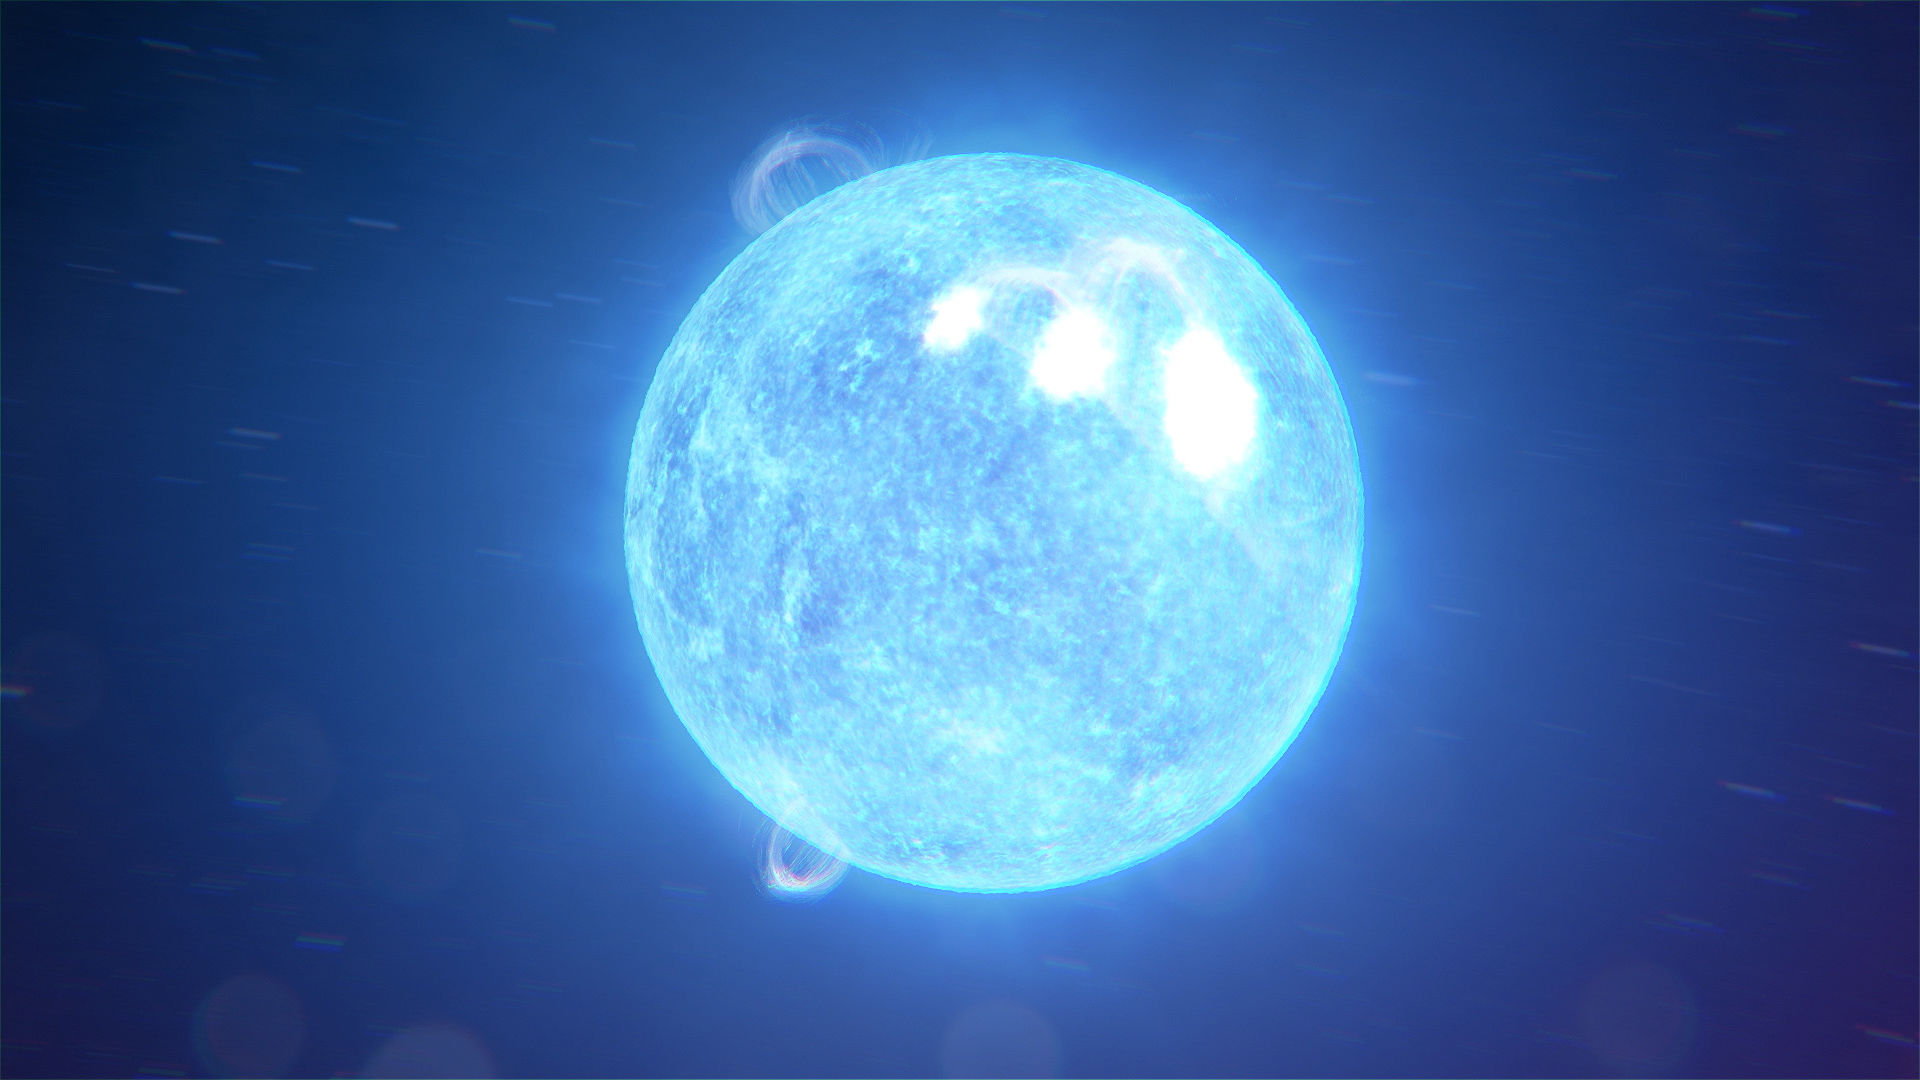
The sources of data that were relevant to our work were observations of neutron stars like those by NICER, the Neutron Star Interior Composition Explorer. It observes neutron stars with hotspots, reading the pulses in x-ray emission that these hotspots emit.
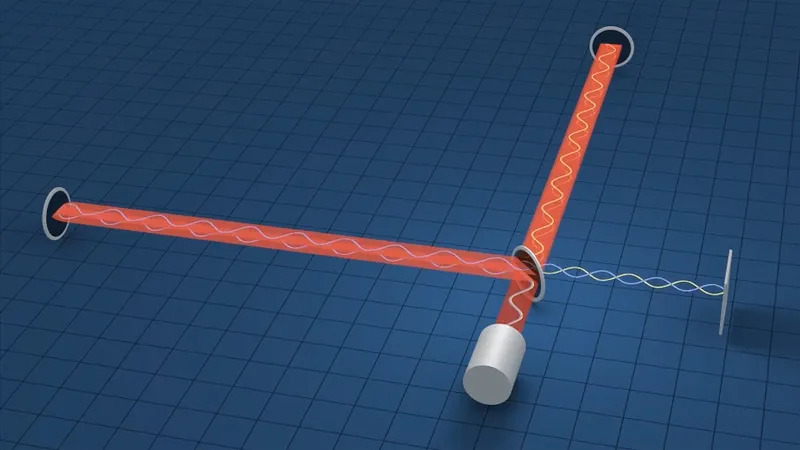
There was also the gravitational-waves detected by LIGO from the coalescence of two neutron stars in orbit to each other. As you’ve all likely heard these are disturbances in space-time that ramp up up to the collision or coalescence of compact objects like black holes and neutron stars.
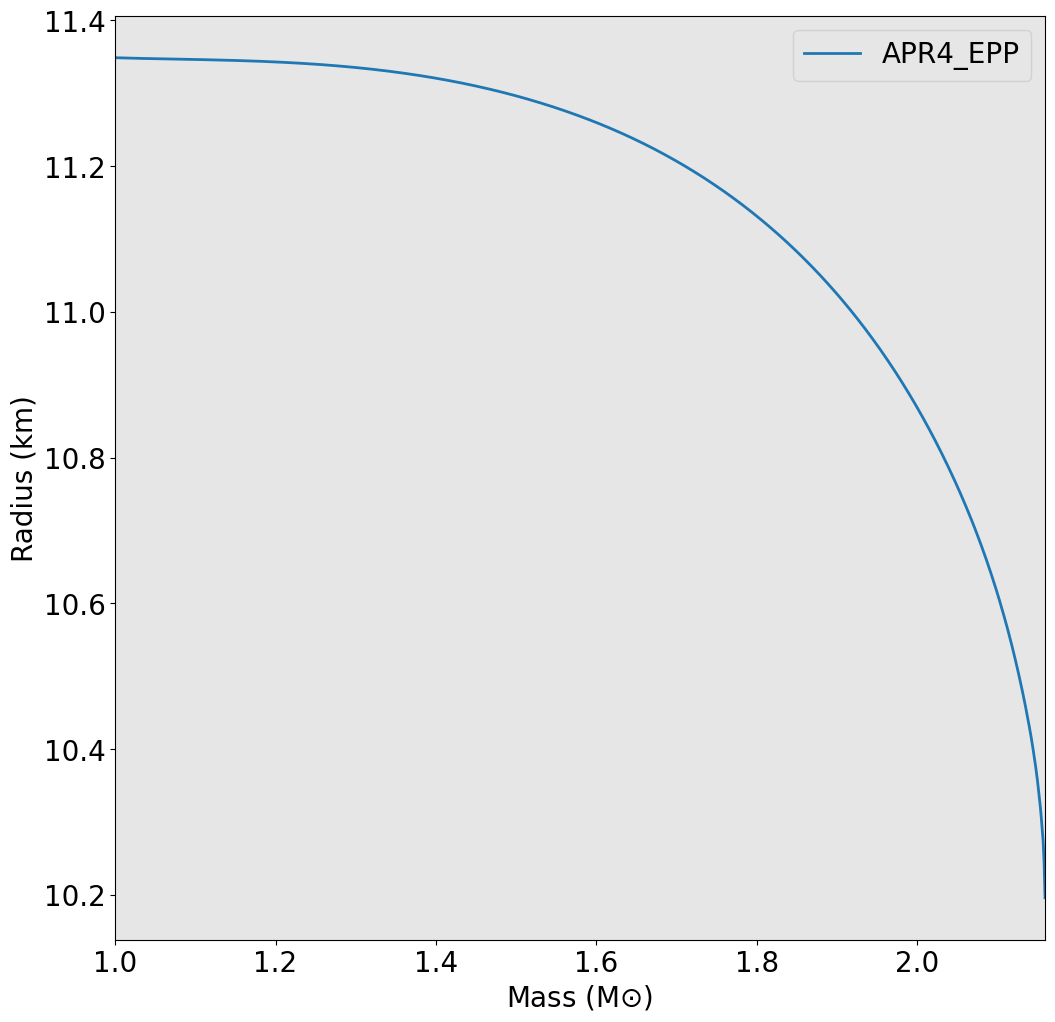
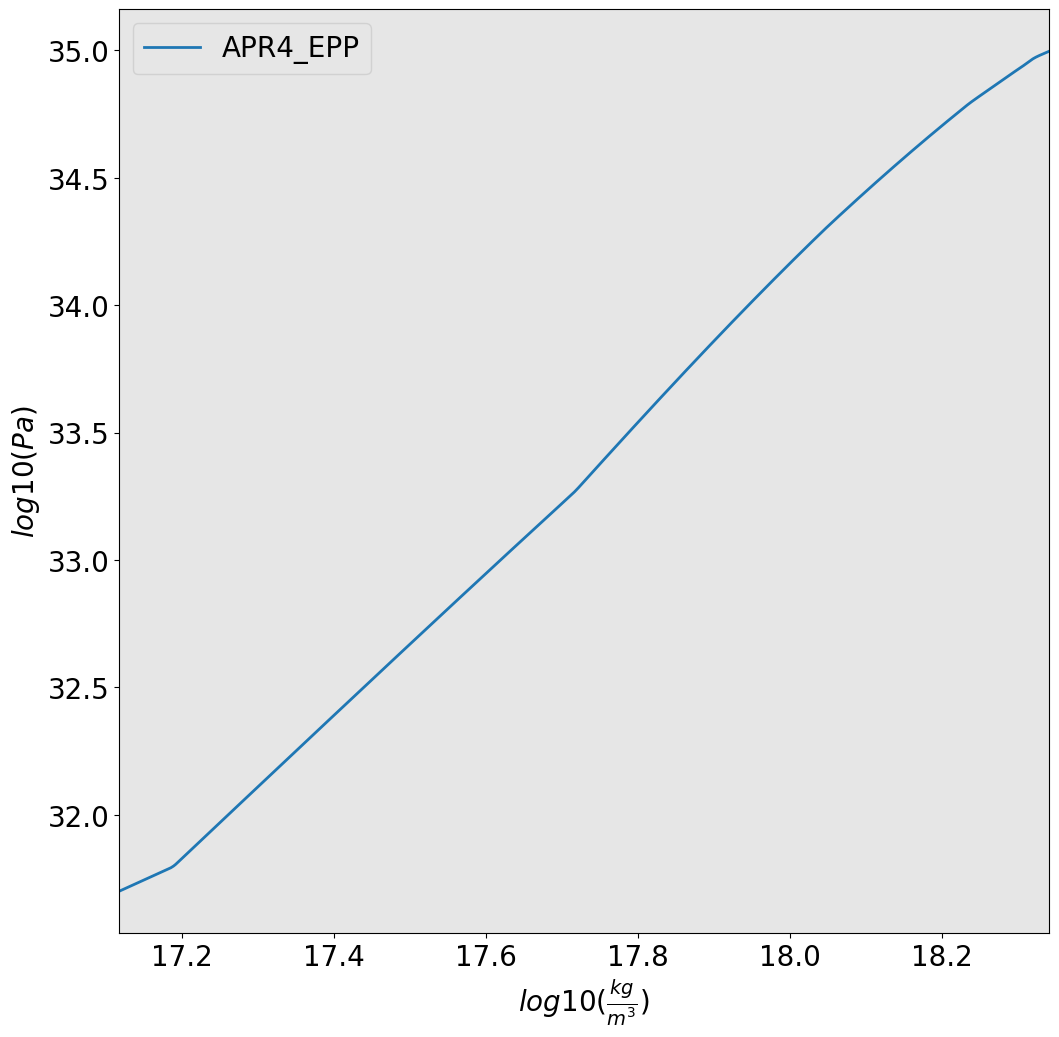
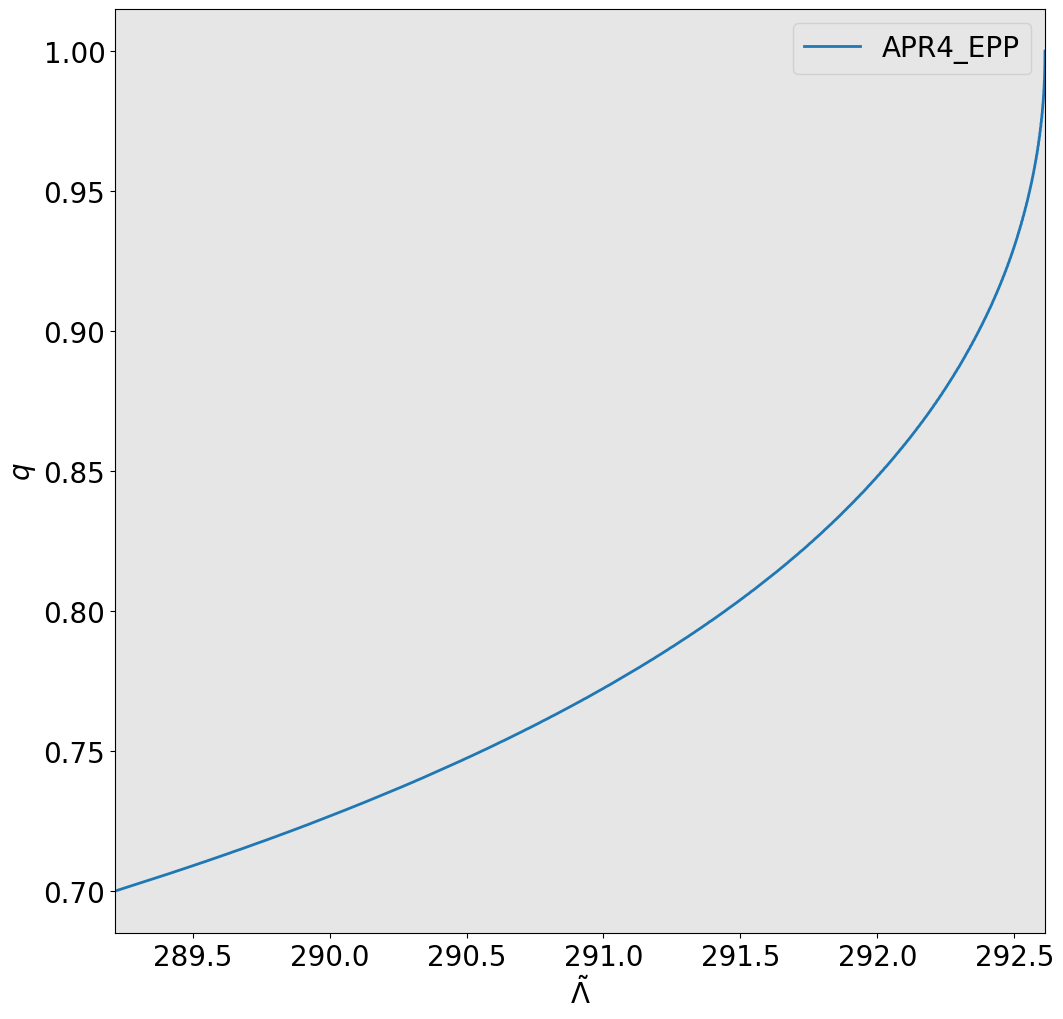
Now we are interested in the equation of state of NSs. This EoS is really just a pressure - energy density relationship. NSs, ignoring exotic matter, are simple objects. Because of this, the left microscopic relationship (the p-rho relation of NS matter), and be easily translated to a radius - mass relationship, or even describe a NS binary’s combined mass vs combined tidal deformability relationship. The curves I’m showing here are produced from one of the many proposed EoS models in the literature. These models each have their own prediction for what the EoS looks like, but it is still to this day unknown.
Its a huge mystery that, if solved, wouldn’t just mean understanding NSs, but also understanding the strong nuclear force that is dominant in them.
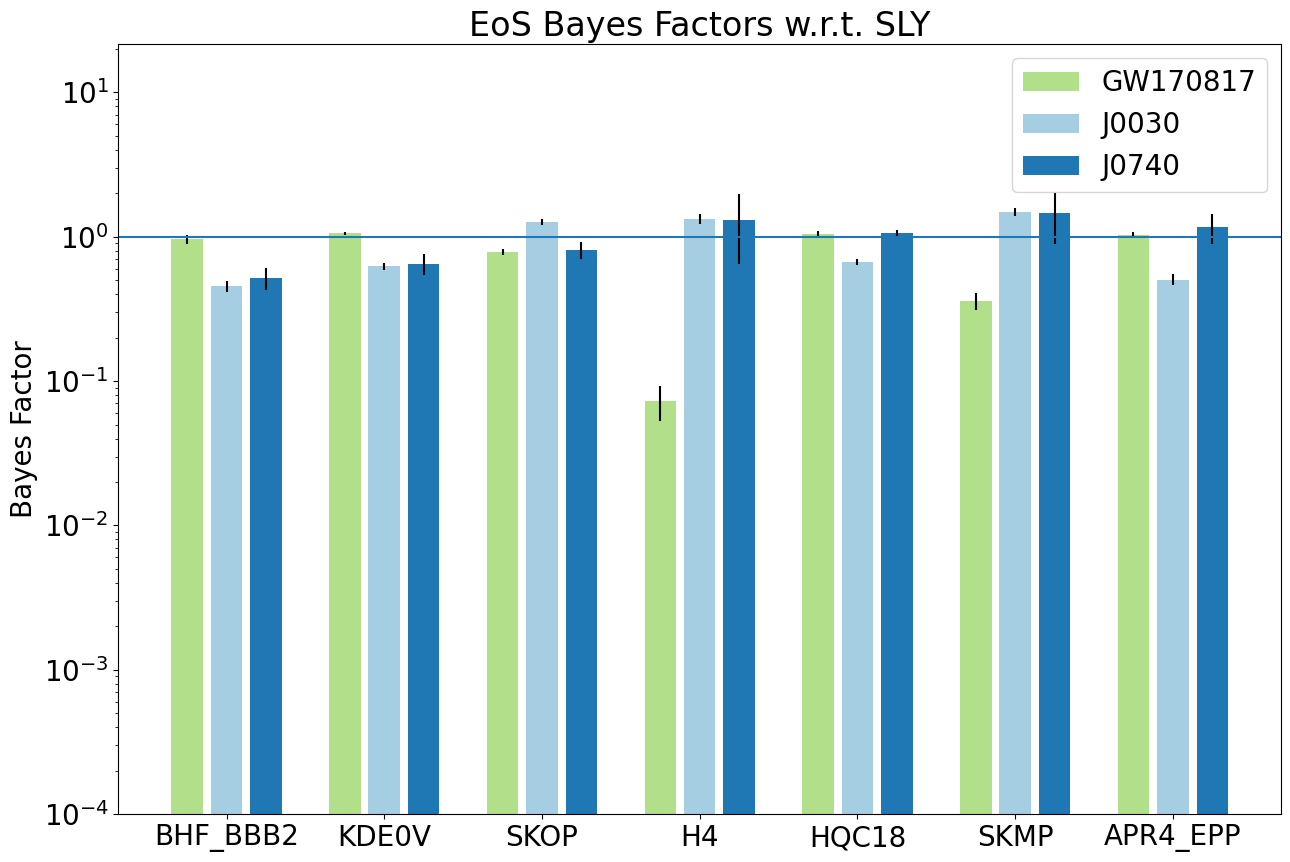
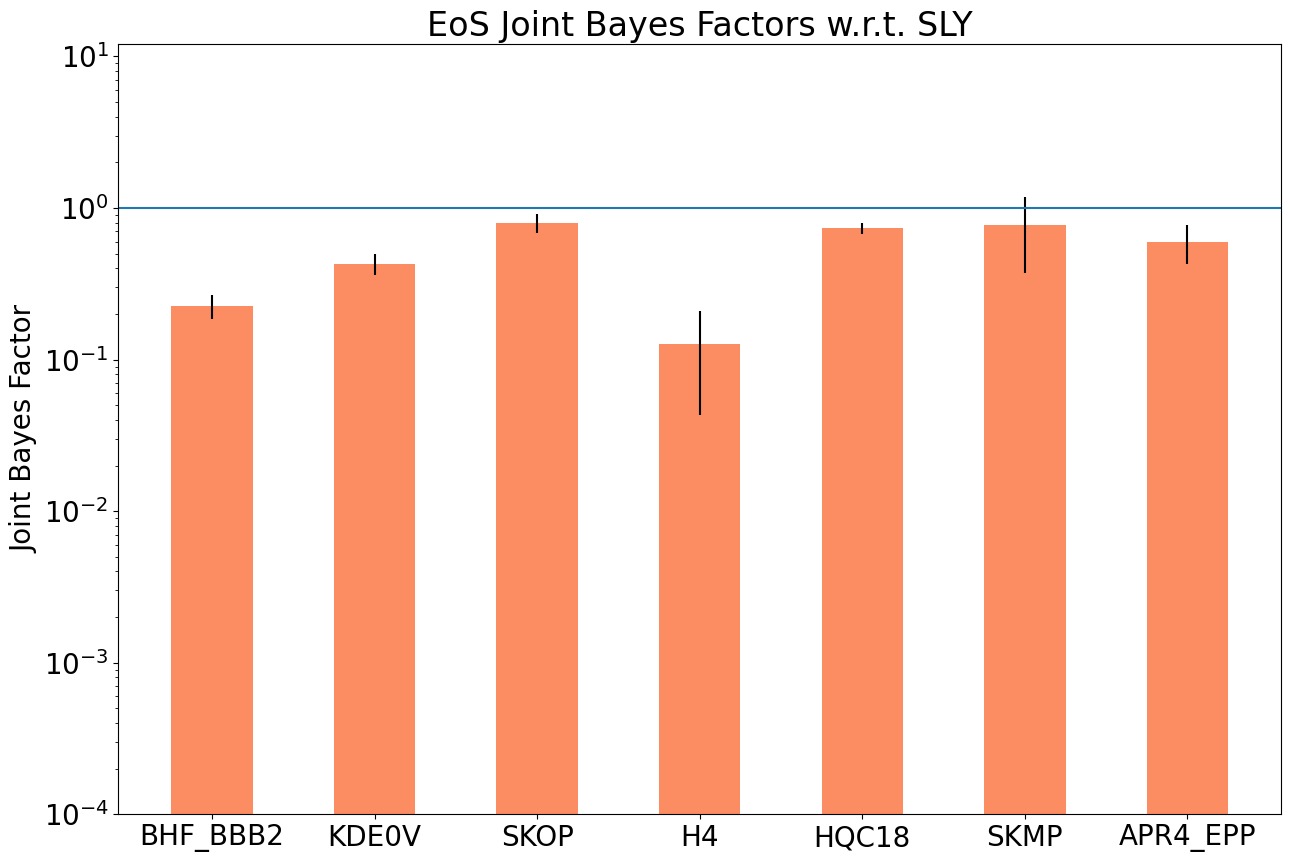
Again, there’s two types of results from this work. Firstly is our model comparison of different EoSs. Second is our own constraint on the EoS in it pressure density form.
For a handful of “well-behaved” EoSs here are the BFs from PSR J0030 as well as PSR J0740. Another high SNR observation by NICER of a pulsar.
As you can see the GW BFs in green and EM BFs in blue are drastically different which was a surprise. This is still a bit of active research my collaborators in MSU are working on. Now there’s such thing as a Joint Bayes factor where you combine (really just multiply) the different BFs of each model, in which we can just ignore that situation. What’s on the right is just that, a multi-messenger result for NS EoS model selection.
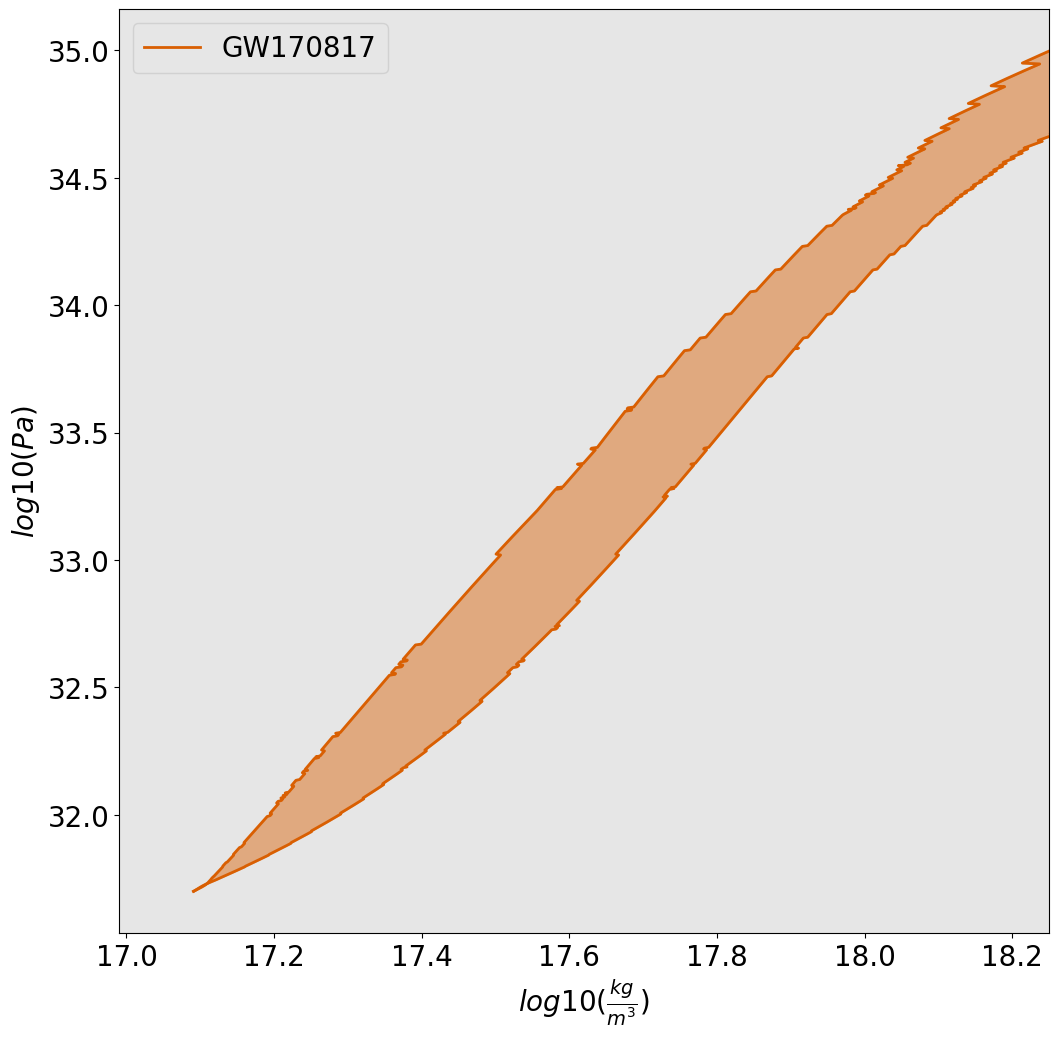
you have a 90% confidence interval! On the left is a 90% confidence interval on the pressure - density relation of NSs from our premier grav wave source GW170817. You’ll notice that it converges on the left to a line before getting cut-off. The line should go on, that’s a plotting error. Anyway the point in this parameter space where that line spreads is where we no longer understand matter in these conditions.
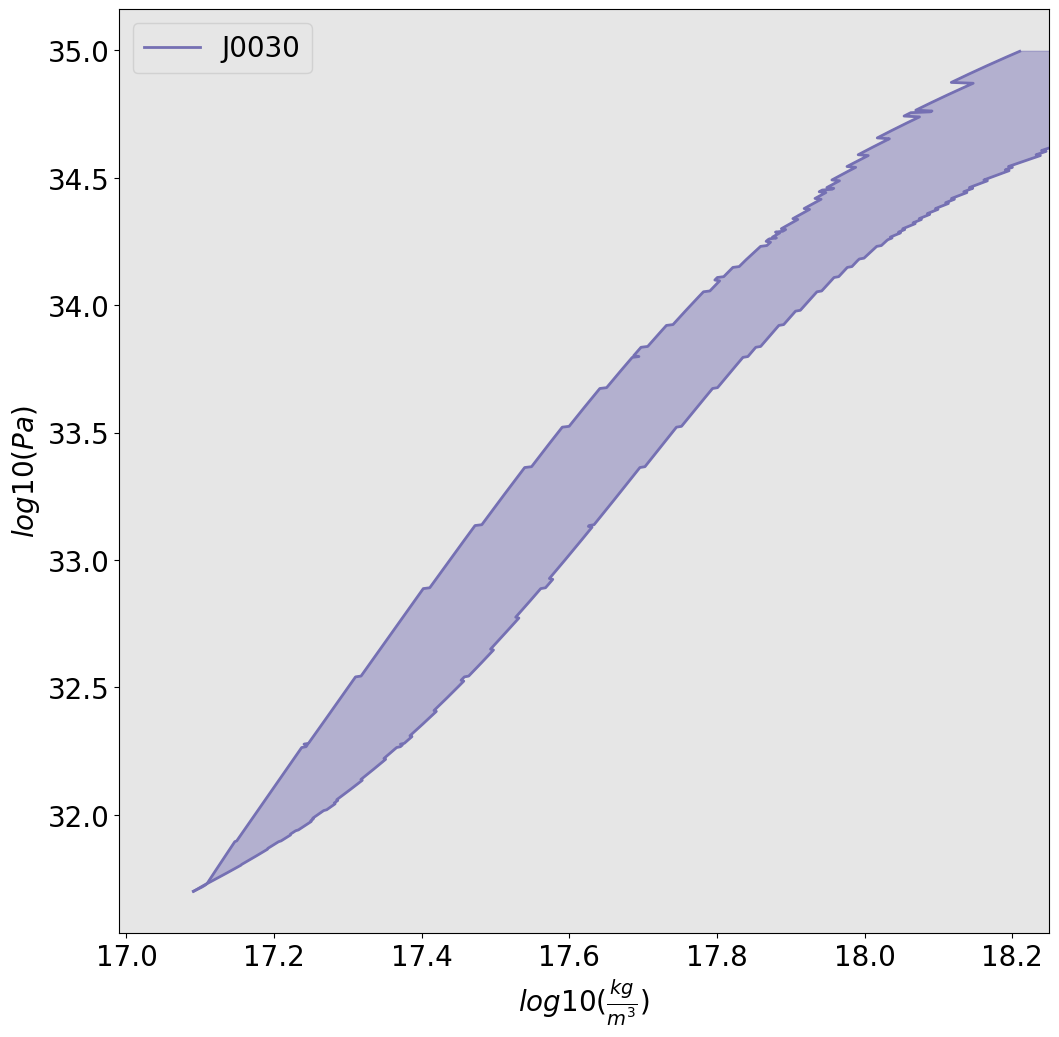
Using the same sampler we obtained a constraint for PSR J0030 too! Now while getting a constraint like this from the observations of NSs is absolutely rad and still really impressive for me, it isn’t quite there yet. This confidence interval is spanning orders of magnitude in the pressure and density axes. So there’s more work to be done.
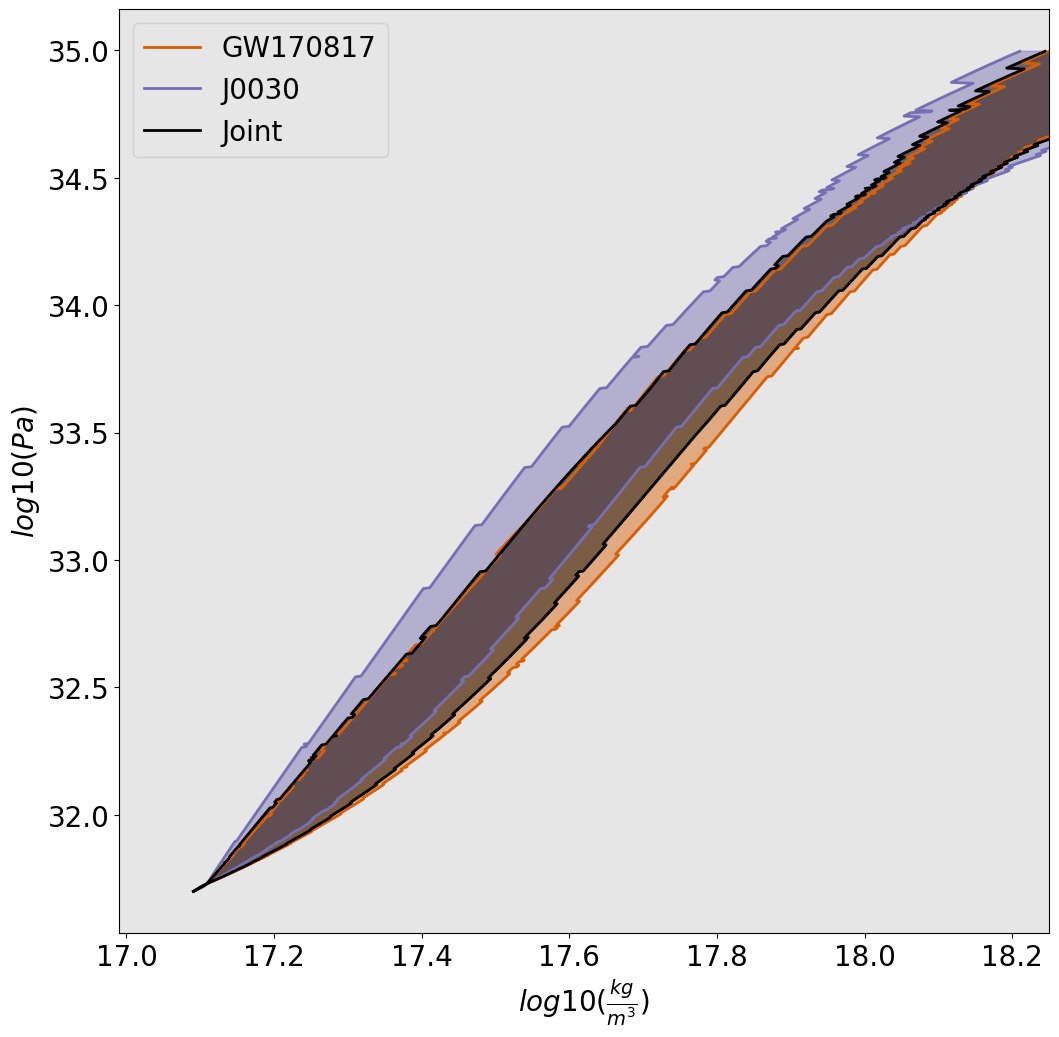
Some additional work was done to combine the results from these two sources to get a joint constraint on the relation and therefore the EoS of NSs. While it may look like we just shaded in the area where they both meet, it did require some bayesian logic and altering to the sampler. That said that is what I did before I was told otherwise.
